Dashboard
Using the dashboard
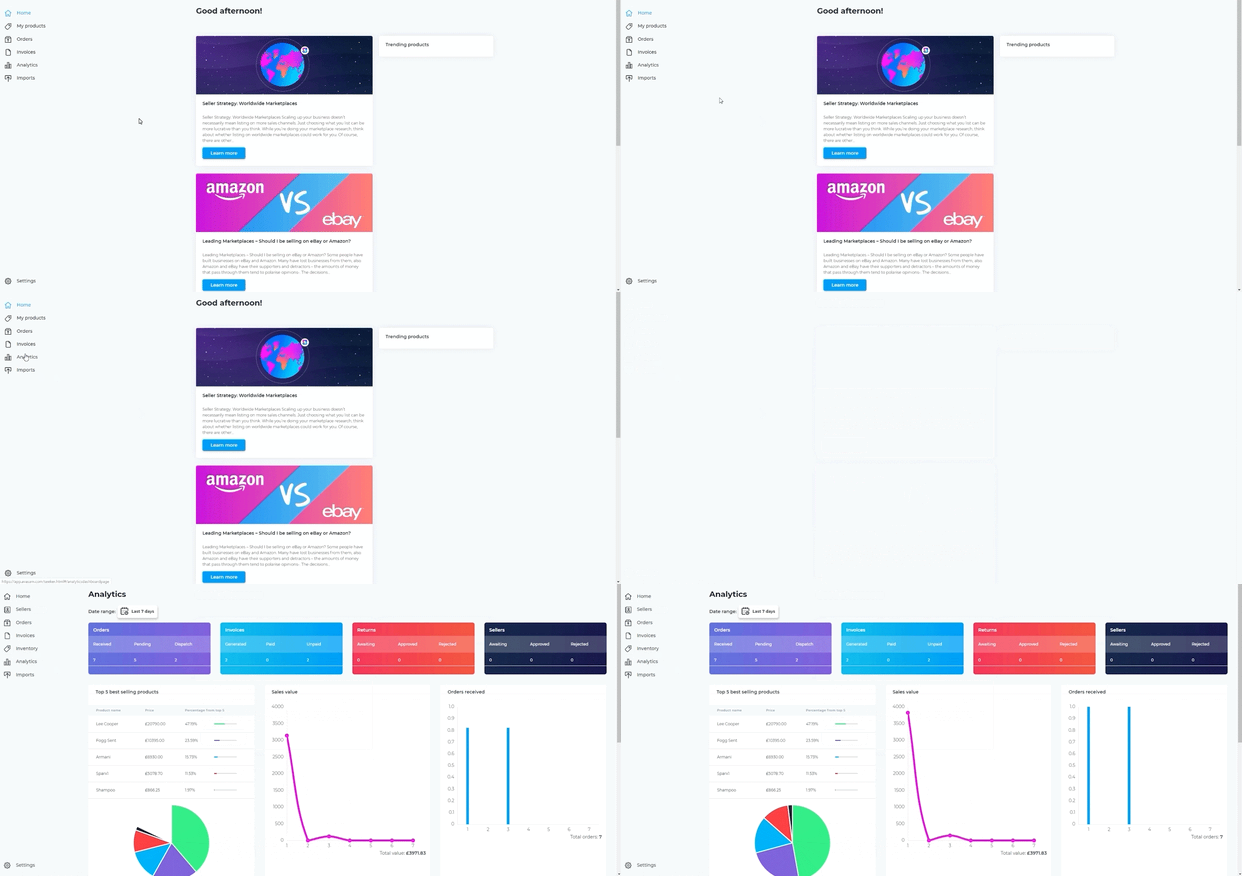
The analytics dashboard gives a comprehensive overview of your business on Avasam
The analytics dashboard summarises key information about orders, invoices, returns, and sellers who have ordered from you.
If you open this page before you have configured Avasam, then you will see a blank dashboard. Similarly, an incorrectly-set filter may result in no results being shown.
Once there is data available, then the screen will appear as follows:

The different categories are summarised at the top of the page, and contain the following information:
- Sales
- Inventory: the number of items sourced and added to the inventory in the selected period
- Sales value: the total value of orders paid in the period selected
- Average shipping cost: the average cost of shipping per order in the selected period
- Orders
- Open: the number of orders received during the selected period which have not yet been dispatched
- Pending: the paid orders awaiting dispatch that were received in the selected period
- Processed: the number of orders marked as dispatched in the selected period
- Top five products sold
- Product name
- Price
- Percentage from top five (proportion of the total sales represented by this product)
- Sales value
- Daily sales value (on the vertical axis): shows the total value of all sales on a given date
- Date (on the horizontal axis)
- Orders received
- Total orders (on the vertical axis): the total number of orders received on a given date
- Date (on the horizontal axis)
- Top five best-selling products
- The five best-selling products from your inventory during the selected period and their proportion of the total sales by product.
Dashboard filter
To filter information in your dashboard:
- Click ‘filter’
- Select a time period and then click ‘apply’.
tip
- ‘Cancel’ will undo any changes you have made and will not update the reports.